This is a technical post on how the availability of food energy (kilojoules/ calories) affects population growth and competition. It is technical and is for advanced readers.
I would be very interested in any up to date review as I have been using a model created in the 1800’s with Verhulst’s Logistic Function which mathematically models Malthus‘ ideas. While this seems to work with many things, I would be interested in a more modern model.
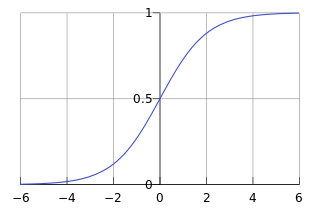
Logistic Function Curve
Above is the basic growth curve of the logistic function vs time. (from Wikipedia). The start of the curve shows that the founder population slowly establishes itself, then thrives, then plateaus and finally reaches the peak population density- the carrying capacity of the environment.
“Letting P represent population size (N is often used in ecology instead) and t represent time, this model is formalized by the differential equation:
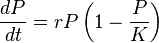
Logistic Equation in population growth
where the constant r defines the growth rate and K is the carrying capacity.” (Wikipedia)
In a long term natural situation the population has hit the carrying capacity which is determined by the available calories (and predator activity and illness etc). When the Neolithic diet came along, then the available calories sky-rocketed leading to a massive increase in carrying capacity for humans.
This sky rocketed further with recent advances in agricultural science such as the Haber-Bosch reaction (sustaining 1/3 of the world’s population which might have a ceiling of 5 billion without it), and reduced death rate from medical improvements, sanitation etc.
This model fits with the Neolithic revolution giving us an explosion in population rate of growth (increased birth rate), and increased population ceiling (albeit unhealthy hordes). As calories increase 2 fold with cooking of inedible plant food, then another 10 to 100 fold by the advent of farming, there is a massive increase in carrying capacity/ population ceiling.
I view evolutionary population dynamics as the competition between a number of these Verhulst curves competing simultaneously, as demonstrated below.

Competing population growth curves
The idea is to view the curves as populations that are all competing with each other. The winners will be the ones who grow the fastest (steepest) and the highest.The light blue line might be a pastoral tribe, and the violet line a cereal farming tribe. The red dashed line would be a hunter gatherer tribe who would be swamped by the others. I would put my money on the light blue and violet tribes in this example.
This perspective takes the view that evolution is a competition for energy. This is something of a contrast to the usual focus of it being a competition among different DNA’s for pre-eminence. Which is the primary competition? You be the judge.
Malthus foresaw a nasty finish in his work- A Malthusian catastrophe (also known as Malthusian check) was originally foreseen to be a forced return to subsistence-level conditions once population growth had outpaced agricultural production. There have been many population catastrophes in history, and many are described in Jared Diamond’s fascinating book Collapse: How Societies Choose to Fail or Succeed. A huge difference between hunter gatherers and Neolithic farmers is that hunter gatherers improve the habitat, whereas farming methods generally destroy it. The oldest clay tablets from Mesopotamia (Stephanie Dalley, Myths from Mesopotamia) include references to wheat farms causing salinity of the soil.
Catastrophes always remind me of Rene Thom’s catastrophe theory which is a straightforward and useful theory that all scientists would benefit from knowing the simple basics of. Essentially when things go wrong in the natural world, it is more like a fall from a cliff than a stroll down a hill. One of the corollaries of catastrophe theory (seems to me) is that by the time it is statistically proven that the catastrophe will occur, it is too late to stop it (think avalanche, broken rubber band, light switch etc). This is why I don’t really get into climate change data- because by the time we have irrefutable evidence, it is too late already to stop it. So if we don’t have proof then it is no comfort to me, and if we do have proof then it is already unstoppable. I think this Leunig cartoon sums it up.


 Posted by benbalzer
You must be logged in to post a comment.